
Dr. Troy Shoemaker
Achievement tests are just one snapshot of a student’s academic ability. The image portrayed by standardized test results can change depending upon a number of testing factors including test version, testing norms, calculation method, student maturity, and curricular correlation. It is important to understand the purpose of basic score results and how testing factors affect achievement test scores in order to obtain an accurate picture of student performance.
Understanding Score Results
When interpreting scores, many numeric values will be encountered including raw score, scaled score, grade equivalent, percentile rank, stanine, and normal curve equivalent. Each score is useful for purposes of calculation and general comparison; however, when interpreting individual or group performance on a test, the most informative values are grade equivalent and percentile rank.
Grade Equivalents are used to show improvement from one year to the next. As students progress through school, it is expected that their grade equivalents would indicate the progress. Grade Equivalents are reported as year and month in decimal format. For example, a grade equivalent of 5.4 indicates 5th grade, 4th month of school. It is important to note that scores above or below actual grade level do not indicate academic history and should not be used for artificial advancement.
Percentile Rank shows how well an individual or group did in comparison to other individuals or groups. This is not a percent right or wrong, but rather an indication of the percentage of others who scored higher or lower on the same test. For example, when a student scores at the 50th percentile, it does not imply that the student only answered half of the questions correctly; instead, this rank shows that the student received average results—right in the middle of the testing population.
Tip: To maximize usefulness and reduce cost, limit score reports to those numeric values that have significant meaning to those making academic decisions. Purchasing extended score reports are costly and often wasteful.
Test Versions
Although several reputable, nationally recognized achievement tests exist, scores vary from one test publisher to another. Careful attention should be given to the expressed purpose of the test and its intended measurement. There are many different types of standardized tests.
Common tests used in education include achievement tests, reading diagnostics, aptitude tests or interest inventories, cognitive ability or intelligence tests, personality inventories, and even attitude profiles. Each kind of test is specially designed to provide a particular kind of measurement. Most parents and educators simply want to show some indication of academic progress. For this, the standardized achievement test is most reliable.
Choosing the right kind of test is only the first step. Periodically, publishers update their achievement tests with a different emphasis and format. This often affects scores.
For example, over the years, schools have seen a change in scores as they moved from Stanford’s 7th Edition to the 8th, 9th, and now 10thEdition.
When tests are revised, changes are evident in layout, content, and testing conditions. Earlier tests were more traditional than later tests, and changes in the most recent version include significant differences including the absence of time limits for tests. This means that the results on more recent versions of the test do not necessarily correlate to results from previous versions.
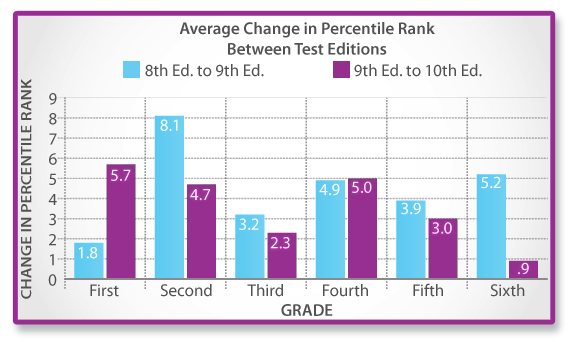
Graph 1
Graph 1 shows how much scores can change when a test is updated to a newer version. With each new revision over a 15 year period of time, the average changes in percentile rank were observed for elementary students taking three different editions of the Stanford Achievement Test.1
Tip: Use the achievement test version that provides the best results for making informed decisions on curriculum and instruction so that academic efficiency can be maximized.
Testing Norms
Achievement tests are a type of norm-referenced test, meaning the results are a comparison of scores to others who have taken the same test. Initially, each publisher utilizes a sample group, called a norming group, to provide a representative basis for future comparison. The ability of the norming group to accurately represent the national testing population affects the results.
As time passes, the norming group becomes less representative of current users. Periodically, tests are re-normed in an effort to make the sample group a closer representation of those who will take the test. When an achievement test is re-normed, the results usually fluctuate. The current Stanford 10 achievement test has norms from 2002 and from 2007. Many schools saw a drop in scores when their results were switched from the earlier norms.
Due to a number of inquiries about changing scores, Pearson, the publisher of the Stanford 10, released documents to explain the difference. They said, “We discover that apparent drops (or increases) are not necessarily real decreases (or increases) in student achievement. We call this the ‘changing norms phenomenon.’”2
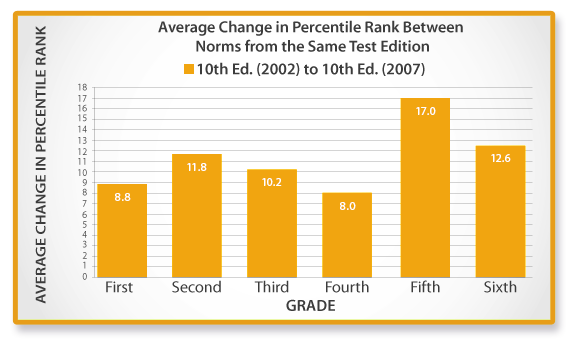 Graph 2
Graph 2 shows that scores can change significantly when new norms are introduced. This represents the average change in percentile rank among elementary students taking the Stanford 10 when norms were changed from the 2002 norms to the 2007 norms.3
Percentile Rank can vary greatly depending upon which norming group is used for comparison. This may be due to a number of factors, but the increased attention given to achievement tests has resulted in some schools teaching toward the test. Pearson refers to this by saying, “Although the content of Stanford 10 has not changed since 2002, some Stanford 10 content and/or format will be familiar to teachers and students. It is not unusual to experience an increase in scores as students and teachers adjust to the new test expectations.”4
Such an increase in scores generally produces lower percentile ranks for most average and above average students.
Tip: If available, use the norm that best correlates to your students. Currently, the Stanford 10 can be scored with either the 2002 norms or the 2007 norms.
Calculation Methods
Scores are calculated in more than one way. One method of calculating results compares an individual’s score to the scores of the individuals in the norming group. These are called individual norms. Another method of figuring results compares an entire group’s scores to groups of similar composition within the total norming group. These are called group norms. Individual norms can fluctuate from time to time due to a variety of factors and are typically lower than group norm; and it is important to note that smaller groups are more easily skewed than larger groups.
According to the Iowa Test of Basic Skills, a student’s individual “percentile rank can vary depending on which group is used to determine the ranking. A student is simultaneously a member of many different groups: all students in her classroom, her building, her school district, her state, and the nation. Different sets of percentile ranks are available with the Iowa Tests of Basic Skills to permit schools to make the most relevant comparisons involving their students.”5
Since group norms are computed differently than individual norms, they cannot be directly compared to each other. While the two methods of calculation produce completely different percentile ranks, the national average is always expressed as the 50th percentile. Documentation for the Stanford Achievement Test explains, “A higher percentage of group norms falls close to the median than do individual norms, so the raw score that is at the 90th percentile for groups may only be at the 65th percentile for students.”6
When comparing results, it is vital to know what calculation method was used for each set of scores. It is not accurate to represent group norms as a measure for comparison to individual norms.
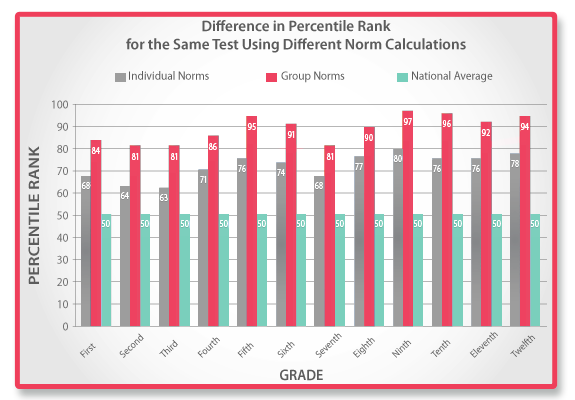
Graph 3
Graph 3 graph shows the difference between group and individual norms. Two different sets of results were obtained from the same test setting: one result from individual norms, and the other from group norms.7
Large organizations, associations, schools, and districts often report their scores in terms of group norms. Never compare individual student results with group results.
Tip: The use of group norms is helpful if you want to publish how well your students do as a collective whole. Individual norms should be used when you wish to analyze strengths and weaknesses within your academic program and its instructional format.
Student Maturity
Scores for young children are less reliable since emotions and attention span are more variable. In addition, during the early years, students develop at varying rates so that test performance can vary from month to month. Academic experts agree that too much emphasis should not be placed on a single set of test results. Rather, it is important to look for trends over time.
If it is necessary to test students at an early age, care must be taken to avoid undue pressure or extreme changes in routine that will have an effect on test results. Since young children are susceptible to distractions, take care to protect students from anything that would impair their performance.
Curricular Correlation
Scores vary from test to test because each publisher utilizes specific academic standards that their test is designed to measure. Tests are not designed to match a particular curriculum. Student performance on a test depends on how well that test is aligned with the curriculum used. Further, a test that emphasizes progressive standards will not be a clear indicator of student achievement in a traditional setting.
Progressive educational philosophies have permeated secular educational circles and today’s achievement tests reflect that philosophy. It would be expected that students learning from a traditional curriculum would score differently than their progressive counterparts.
To determine how well a test publisher or test edition aligns with the curriculum, an item analysis is needed. This analysis correlates each test question with a specific curricular standard.
Tip: Use the achievement test that most closely aligns with your curriculum. The Iowa Test of Basic Skills is easy to understand and traditional on the elementary level, making it a strong option for elementary grades.
Conclusion
Achievement testing can be a wonderful indicator of student progress. Results are useful in guiding academic decisions to benefit students. However, misuse and misinterpretation of test results can be harmful.
Use the test that best provides useful results for academic planning. Avoid the pressure of high-stakes testing; and do not teach for the test, making it the ultimate measure of academic quality.
Historically, students using the Abeka curriculum and materials score very well on standardized tests. Scores are impacted by instructional quality, classroom management, and individual ability. The Abeka curriculum has not been developed around a particular test. Instead, a traditional sequence of subject matter is used that is age appropriate and academically challenging. Young students and those that transfer into the Abeka curriculum typically show stronger academic progress as they continue through the curriculum.

Visit our sister site for the Stanford 10, CogAT, and other standardized tests we offer.
ABEKA TESTING
1 Based upon results from Pensacola Christian Academy complete battery individually normed percentile rank on Stanford Achievement Tests, as reported 1994–2010.2 Stanford Achievement Test Series, Tenth Edition: Special Report, The Changing Norms Phenomenon: Apparent Versus Real Changes in Achievement Performance with Updated Norms for Normed Reference Achievement Tests, 2009.
3 Based upon results from Pensacola Christian Academy complete battery individually normed percentile rank on Stanford Achievement Test, Tenth Edition 2002 norms compared to 2007 norms as reported 2004–2010.
4 Ibid.
5 Iowa Test of Basic Skills website accessed at http://www.education.uiowa.edu/itp/itbs/itbs_interp_score.aspx
6 Harcourt Assessment Inc., Group Norms: Where They Come From and Why They’re so Different from Student Norms, 2007.
7 Based upon results from Pensacola Christian Academy complete battery comparing individually normed percentile rank to group normed percentile rank on Stanford Achievement Test, Tenth Edition 2002 norms as reported in 2007.


Comments for Getting the Most Out of Achievement Test Scores
Add A Comment
Your email address will not be published. Required fields are marked *